As part of his new budget proposal, Wisconsin Governor Walker has proposed the expansion of the school voucher program (Currently confined to Milwaukee and Racine) to a large number of districts, including Green Bay and Madison. Such a voucher program allows students to spend a vouchers at charter or public voucher schools. I generally don’t have strong feelings about school vouchers. They clearly have a role to play in some hopelessly failing school districts, but in most districts that allow for vouchers many of the charter schools still are failing. See the 2010 documentary Waiting for Superman, for a good example of the lottery process that decides enrollment to the best charter schools in many such school districts. In any case, I will not address the issue of school vouchers in detail here; rather, I will subject some claims about Wisconsin public schools to quantitative scrutiny. Luckily The Wisconsin Department of Public Instruction (WDPI) has released excellent school level demographic and achievement data that should give us some clue about what to think on this issue. In this post I will systematically consider this data, first describing it and then testing a number of hypotheses that are important for the debate over school vouchers in Wisconsin.
How are Wisconsin schools doing?
Let us first examine how Wisconsin schools did on the “Accountability Rating,” which is a composite measure of several factors that the WDPI deemed important for successful schools. Note that this is predominantly a measure of school success, such as meeting certain goals, and not one of student success. This means that two schools with the same accountability ratings may have students who are performing very differently (and vice versa). WDPI also provides performance only data, but I will not address that in this post. For now let us just assume that the “Accountability Rating” is a good measure of school success.
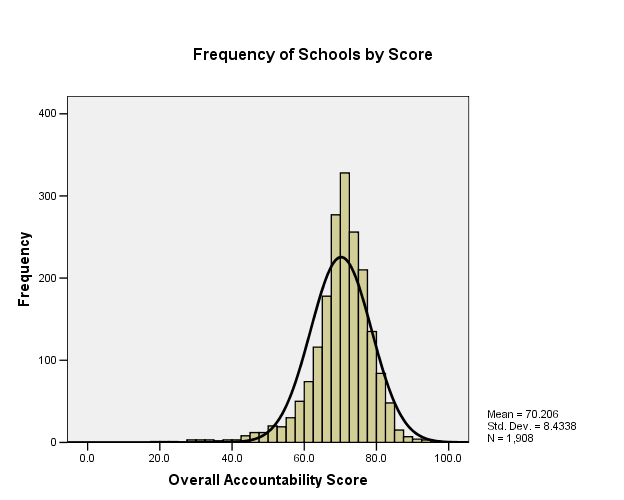
To the left is a frequency distribution of schools according to their accountability rating. The scores range from 0 to 100, though contrary to what some in the media have done, we should not immediately apply standard letter grades to them in the “standard” fashion. Remember, that these are composite scores, and thus have no natural relation to what we normally take to be letter grades. This graph affirm this. The distribution of scores is normal (it matches pretty closely the normal distribution function overlaid on the data), though its average is only about 70. Typically letter grades are either applied by using some fixed set of standards or through the use of a curving procedure. The curving procedure typically forces the set of scores to conform to a normal distribution, with the mean of the sample set to a B- or C+ (though sometimes as low as a C), and assigns each grade to some percentage of scores. Using this method, we would (roughly) assign As to the 80 – 100 interval, Bs to 72 – 79, Cs to 65-71, Ds to 59-64, and Fs to all under 59 (assuming 8% As, 30% Bs, 40% Cs, 14% Ds, and 8% Fs).
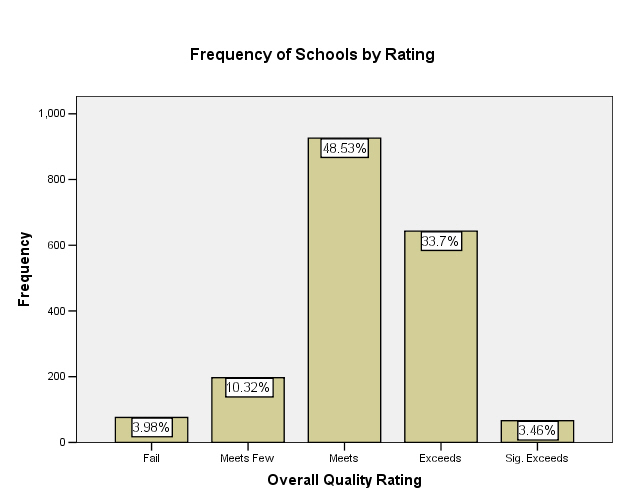
However, this would be the incorrect way to grade these scores, because WDPI has already fixed standards for grading the scores. They provide us with five grades for the achievement scores, which correspond roughly to the standard letter grades. Under this grading, 83-100 “significantly exceeds expectations”, 73-82.9 “exceeds expectations”, 63-72.9 “meets expectations”, 53-62.9 “meets few expectations,” and under 52.9 “fails to meet expectations.” Although the distribution of these grades (seen in the figure to the left) is weighted more heavily toward “meets expectations” than the standard grading distribution is weighted toward C, it roughly corresponds to the normal distribution of grades that we expect from any standard grading system.
The Governor has suggested that districts with schools that either fail to meet or meet few expectations should be opened to the school voucher program. Given that these schools are in roughly the bottom 15% of Wisconsin schools and have failed to meet a set of fixed standards, it seems reasonable to think of these schools as “failing” schools in an important sense.
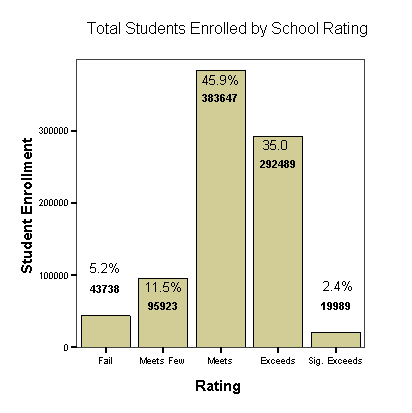
I will address the efficacy of vouchers at helping students in such schools soon, but let us first get a sense of how many students are in such schools as well as some important features of those students. The figures above are frequency distributions of schools, not students. Luckily WDPI provides us with enrollment figures, so we can also determine how many are in failing schools. This shows that 16.7% of students are in failing schools; the discrepancy in this figure from the percentage of failing schools is not all that unexpected. One might conclude from this that larger schools fair more poorly than smaller ones. And indeed a test of significance reveals a statistically significant negative correlation between the enrollment size of a school and the overall accountability score, meaning that larger schools seem to obtain lower scores. Some of this correlation is likely due to statistically significant lower scores in non-elementary schools, an effect which is especially strong for combined primary/secondary schools (for whatever reasons). We may be able to disentangle these effects with a more complex analysis, though I will not do this here.
Poverty is highly correlated with low school achievment
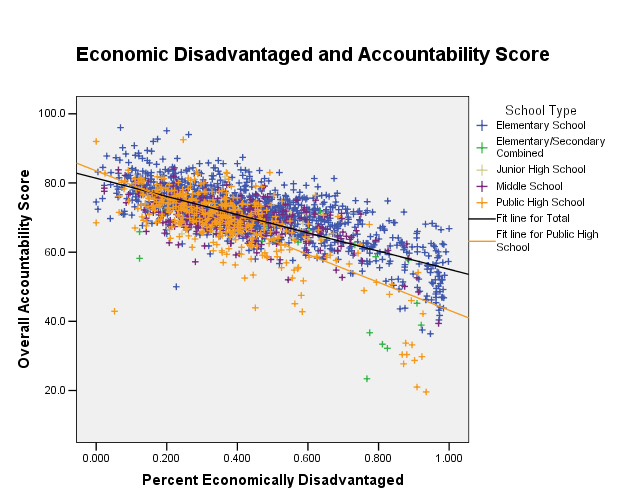
We can also characterize some of the possible causes of lower test scores. Luckily we have information for each school about the percentage of students who are economically disadvantaged as well as those not proficient in English; these are both commonly thought to negatively affect student performance. It is often thought, at least in Wisconsin, that one major problem facing schools is the rapid influx of new Spanish speaking immigrants. Thus it is thought that one way to improve schools is the adoption of an “English First” strategy, in which we ensure that all students understand English before teaching anything else. Another view holds that poverty is one of the major causes of poor school performance.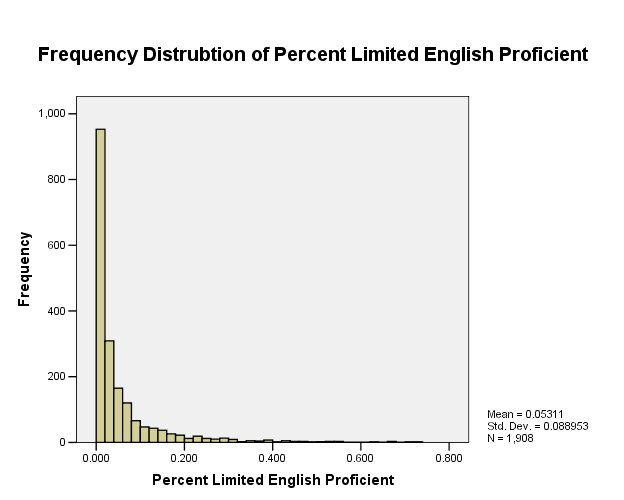
Although we cannot test these hypotheses directly with our present data, we can test whether there exist correlations in the data that are consistent with them, as well as whether either a lack of English proficiency and/or poverty are a prevalent within Wisconsin schools. Indeed, as expected, both the percentage of economically disadvantaged students and the percentage of students with limited English proficiency are negatively correlated with school overall accountability score, though the magnitude of the correlation for economic disadvantage is about twice that of limited English proficiency (-0.677 vs. -0.229). Additionally, as expected, these two factors are positively correlated with one another as well (0.411). However, these two features display very different frequency distributions , as can be seen in the plots I give here. Many schools have a relatively large percentage of economically disadvantaged students. In fact, more than half of schools have a percentage of economically disadvantaged students greater than 39%, and more than 30% of schools have more than half economically disadvantaged students.
However, very few Wisconsin schools have a significant population of students who are not proficient in English; only 5% of schools have a non-proficient population that is greater than 23% of their total student population. It is very likely that schools with large proportions of students who are not proficient in English will tend to score worse, if only because language skills are important for all types of learning, but the data don’t seem to indicate that this is a major impediment to learning for most students in Wisconsin or for the success of most schools. Rather, poverty seems to be a far more widespread problem for Wisconsin schools. This seems to suggest that social programs which combat economic problems within the student population may also improve school performance. Of course, the data as it is does not support any more definitive statement about the role of poverty in school failure, but it does give us good reason to pursue that possibility further (and much has already been written on this subject already).
No support for the superiority of charter schools in the Wisconsin data
The final question I will consider is also the most interesting. Do students in charter schools perform better than similar students in normal public schools? The claim by many supporters of charter schools is that there is something wrong with poor performing public schools over and above the deficits of the students, and that charter schools generally perform better. In order to investigate this question we must find some set of charter and public schools that are well matched in other respects. This is made more difficult by the fact that just over half of all charter schools did not report accountability scores at all. Obviously this is a serious deficit for any investigation of the efficacy of charter schools, and hopefully is corrected in the future. However, we do have data from 102 charter schools, which is a pretty good sample, and so I will continue with the analysis by only considering these schools.
 A further difficulty arises when attempting to find a comparison class of public schools which are similar to the set of charter schools in most respects. If we compare all charter schools with all public schools, we find that the public schools have significantly higher scores than the charters, but they also have significantly fewer students in poverty as well.
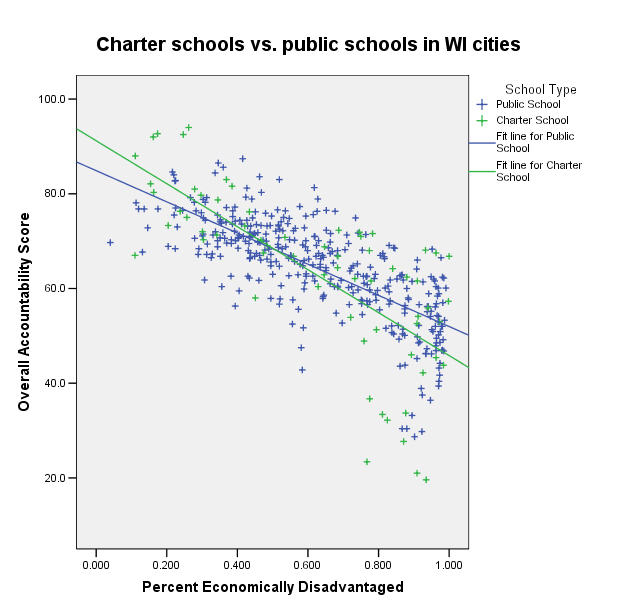
Because we showed previously that lower numbers of students in poverty is negatively correlated with higher scores, this is an unfair comparison. We can, however, trim down our sample of schools such that both the charter school sample and the public school sample are similar with respect to economic disadvantage (as well as English proficiency for good measure). This is not easy and requires us to limit our consideration to only those schools within what the WDPI calls “cities” (this includes large cities like Milwaukee, medium-sized cities such as Madison and Green Bay, as well as small cities such as Eau Claire and Appleton). This is significant choice in my analysis, but it is the most straightforward way to match the two samples for economic disadvantage; all larger comparison sets I tested had significantly lower rates of economically disadvantaged students and higher accountability scores than the charter school set.
Comparing charter schools to regular public schools in Wisconsin cities, we find no significant difference in the percentage of economically disadvantaged children between charter and public schools, but also no significant differences in overall accountability score (using a simple t-test hypothesis test). We obtain similar results if we just consider those schools in Milwaukee. This result was very non-significant (significance level = 0.618), with the mean accountability score of non-charter schools being higher than that of charter schools. A scatter plot of these results, with charter and non-charter schools marked in green and blue respectively, is shown above; the plotted regression lines are consistent with there being no significant difference in accountability score between charter and non-charter schools. Therefore there doesn’t seem to be any evidence from the accountability data that charter schools perform better than normal public schools. We could continue analyzing these data (perhaps with more complex methods) in an attempt to find some benefit to charter schools, though I don’t think this will provide much benefit. The proponent of charter schools would seem to have the burden of proof to demonstrate their efficacy, and this has unfortunately not been addressed in the current policy debate in Wisconsin.